Analytics
Analytics shows how people find and move through your published site.
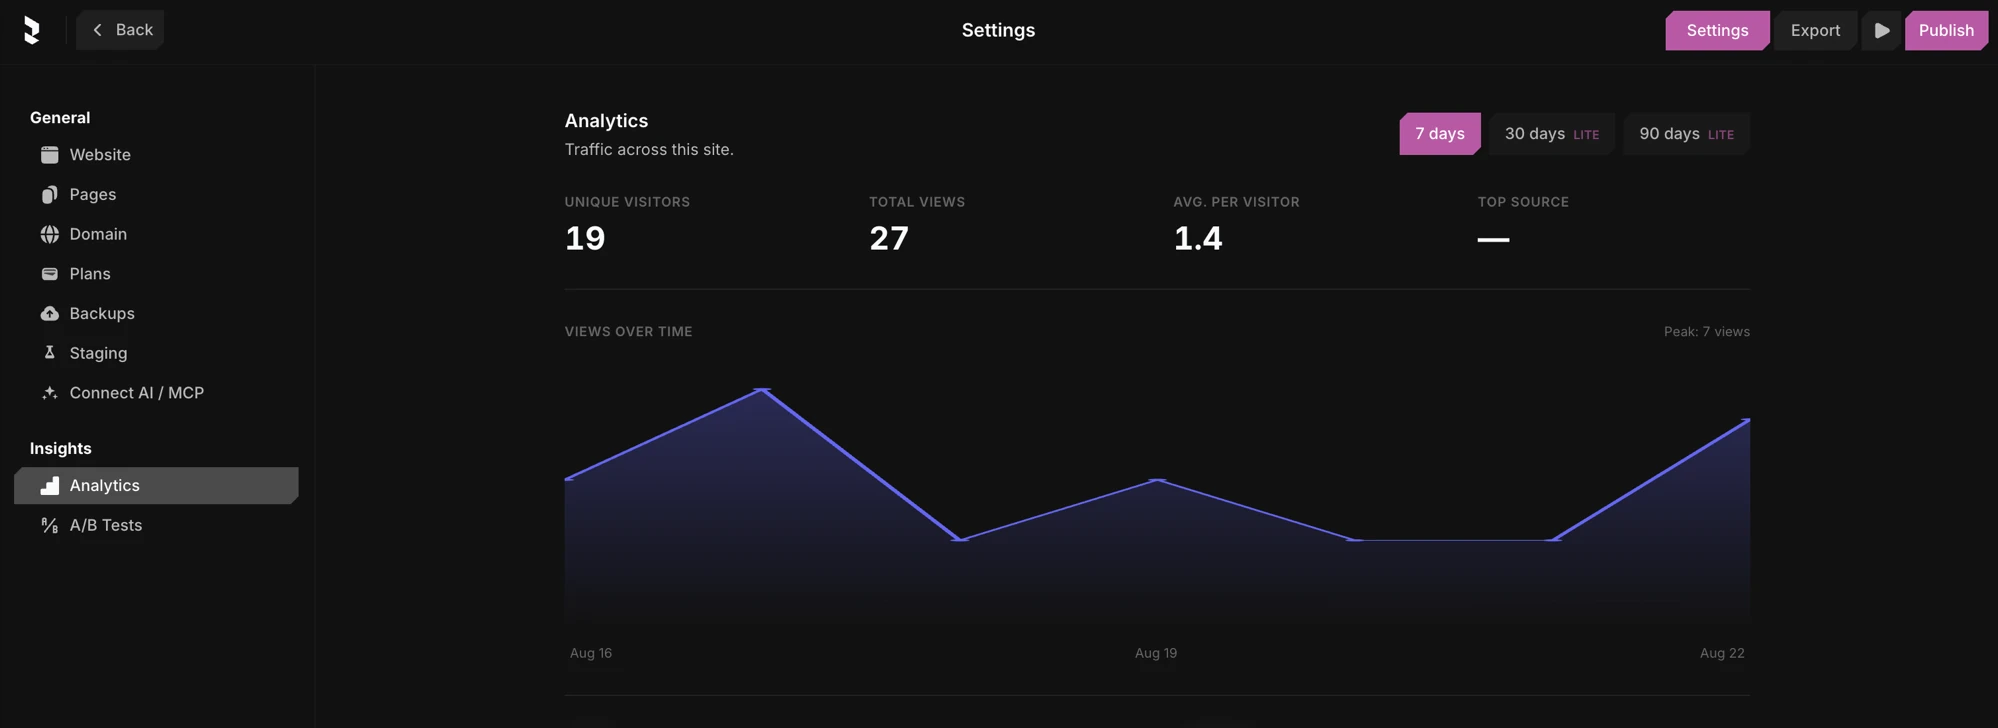
Open analytics
Open Settings → Analytics. Everything on the dashboard updates together for the time range you pick.
Time range
Switch every chart and number between 7 days, 30 days, and 90 days.
Summary metrics
The row at the top gives you the headline numbers at a glance:
- Unique visitors - distinct people who visited.
- Total views - all page views in the period.
- Avg. per visitor - views divided by unique visitors.
- Top source - the single biggest channel sending you traffic.
Views over time
A chart of views across the selected period, with the peak day called out.
Breakdowns
Below the chart, four lists rank where your traffic comes from and who it is:
- Pages - your most-visited pages.
- Sources - where visitors came from (direct, referrals, etc.).
- Countries - visitors by location.
- Devices - the split across desktop, tablet, and mobile.
Plan limits
Some advanced views depend on your plan.